

Ever since I started following college hockey, I’ve witnessed numerous rebuilds executed by great coaches. Starting from a low point, they manage to build up their programs with incremental gains every year until reaching varying levels of relevancy. These rebuilds all follow essentially the same pattern for the first 5 years:
Year 1 - suck
Year 2 - turn over the roster and the coach brings in “his guys”, improved team but inconsistent (and usually young)
Year 3 - first year of being good and competitive
Year 4 - a bit of stagnation but still a good and competitive team
Year 5 - the peak
Sometimes years 4 and 5 are reversed, but that’s the general pattern. There’s numerous programs in the past decade with new coaching hires who have generally followed this pattern, and we’ll be going over their results to show the type of season to expect from RPI. First, here’s our examples that we’ll be using as a baseline:
Atlantic Hockey
Bentley (2023-Present), Andy Jones
Holy Cross (2021-2026), Bill Riga
AIC (2016-2021), Eric Lang
CCHA
Augustana (2023-Present), Garrett Raboin
St. Thomas (2021-2026), Rico Blasi
ECAC
Dartmouth (2021-2026), Reid Cashman
Princeton (2024-Present), Ben Syer
RPI (2017-2020), Dave Smith (including first 3 years before COVID derailed the rebuild)
Union (2022-Present), Josh Hauge
Hockey East
Maine (2021-2026), Ben Barr
UMass (2016-2021), Greg Carvel
Merrimack (2018-2023), Scott Borek
Independent
LIU (2020-2025), Brett Riley
NCHC
Miami (2024-Present), Anthony Noreen
Now, let’s start breaking down the numbers and metrics. I’ll also be discussing the progression of the programs to try to contextualize the numbers as best I can.
Wins
First, the simplest metric: wins. How many games did the program win in year 2 of the new head coach? One thing that I’ll also be including though is the improvement from year 1 to year 2 in addition to the raw number.
I think the improvement is arguably just as useful as the raw win total. While all of these rebuilds started from a low point, there is still a lot of variance in that starting point. Some of the ones included were starting from absolutely nothing and were among the worst teams in the country year 1. Others had a little bit more to work with, so they weren’t totally horrible year 1. That context matters.
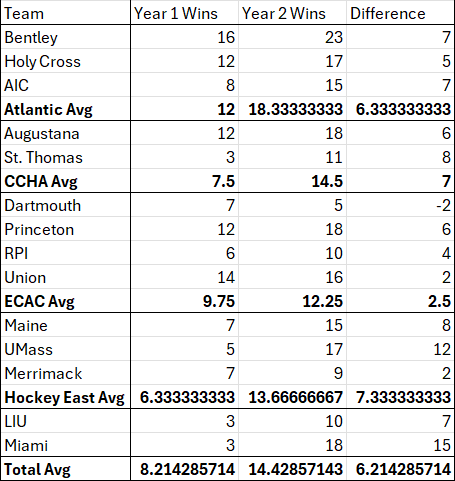
On average, the programs improved by 6 in the win column and finished with 14 wins. Eric Lang’s AIC rebuild was a little higher than that at 7 wins improvement and 15 wins. This rebuild is an important one to look at specifically for context because he is bringing a similar blueprint from AIC over to RPI.
One interesting thing about the data is that the ECAC programs didn’t tend to do as well. Dartmouth is actually the only program that managed a worse 2nd year than 1st year. Even without them included though, the average would be only 4 wins of improvement. I don’t think this is really indicative of a trend showing that ECAC programs are tougher to rebuild though because Princeton and Union were two of the programs who were starting from a higher place with double digit year 1 wins.
The best programs from year 1 to year 2 were Miami, UMass, and Maine with 15, 12 and 8 wins of improvement, respectively. Those would be the high end standard, but they are unlikely to be replicated by RPI this year.
Why do I say that? Well, my biggest takeaway from this data was that it’s a lot easier to have big win increases when you are starting from lower. The biggest increases came from programs with single digit wins in year 1. When you’re starting from practically nothing, there’s nowhere to go but up. Usually these teams are a bit below .500, but starting so low means that the lower programs improve more to get to that point.
Programs starting out with double digit wins would be getting to 20+ wins with that type of improvement, which just is not very realistic in year 2 of a rebuild, even though many got close to it. The programs who started out with double digit wins capped out at 7 wins of improvement with Bentley. They averaged 5.2 wins of improvement.
Standings
Another good marker of improvement is how much the program is moving up in the conference standings. It helps place the program among its peers.
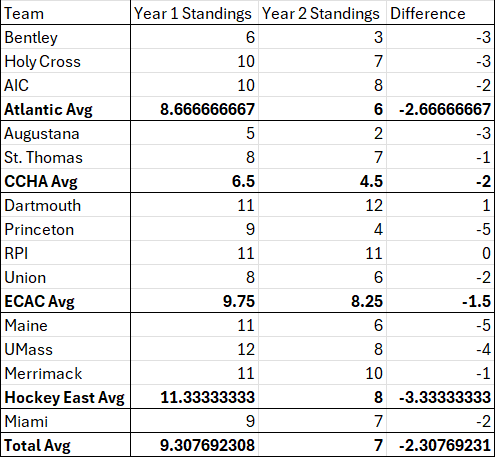
The average standings improvement was about 2 spots in the standings to 7th place. AIC moved up exactly that many spots in year 2 of Lang’s rebuild there and wound up in 8th. The best programs in this category once again included UMass and Maine, but Princeton also was right there with them with 5 spots of improvement. Once again, the ECAC was a little lower than average due to Dartmouth, but without Dartmouth, they’d be right in-line with the average.
I don’t have too much to add here. I think 4 or 5 spots of improvement is unrealistic. Anything below that is plenty realistic though and would be in line with the average.
Pairwise/NPI
This is the most valuable piece of data in my opinion. The Pairwise (formerly) and NPI (now) both are rating systems that factor in strength of schedule alongside a team’s results in order to determine the NCAA tournament field. That makes it the best data point to use in terms of where the programs stood nationally.
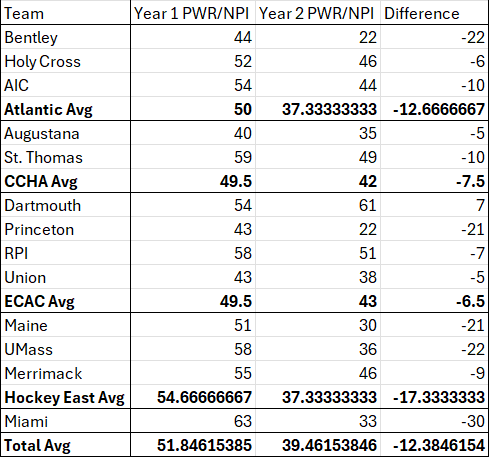
The best programs here are all the same ones mentioned before (Miami, UMass, Maine, and Princeton) with Bentley also joining the list. These teams all rose a whopping 20+ spots in the rankings.
The average team wound up rising 12 spots and at around 40th in the rankings. At AIC, they improved 10 spots to 44th in the rankings. Rather than giving you my opinion just based on my data, I want to contextualize all these performances to paint a deeper picture.
Categorizing the Programs
Looking at the recruiting and roster construction of each of these programs for year 1 to year 2, each one clearly breaks into one of the following categories.
Big and high quality freshman class
Veteran laden team, either inherited or built through the portal
Big and not as high quality freshman class
Balanced
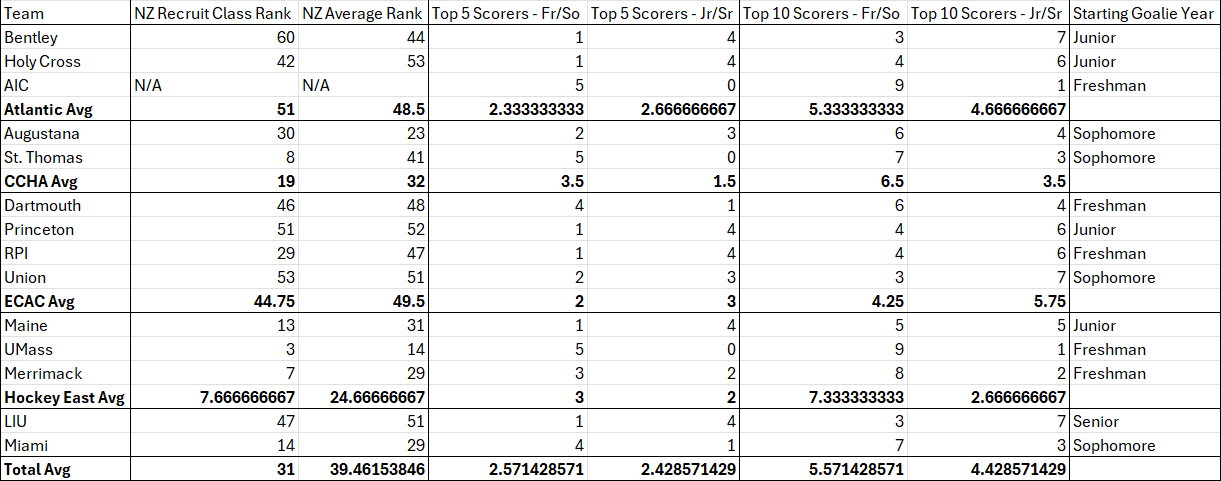
Pasted below is the recruiting and roster info of each program for year 2. The recruiting class rankings come from Neutral Zone, and I included both the overall ranking and the ranking based on the average star level. Then, you can also see how the roster was built based on the other columns. First, how many underclassmen (Freshmen and Sophomores) and upperclassmen (Juniors and Seniors) make up the top 5 scorers and top 10 scorers on the roster are included. Second, I include the year of the primary starter in net. Including the years of the key players on the roster gives you an idea of how young or old it was, and I will add additional context from looking at the rosters. This will be relevant when we breakdown the blueprint of the programs.
Highly Successful
I’m defining the highly successful year 1 to year 2 programs as the ones who improved 20+ spots in the pairwise/NPI.
Bentley was a veteran heavy team with 4/5 and 7/10 top scorers being upperclassmen in addition to the starting goalie. Most of the upperclassmen were acquired through the transfer portal from bigger programs where the players were not getting much ice time. Bentley ended up rising 22 spots in the pairwise to #22, driven by these players, and they got into the NCAA tournament by winning the Atlantic Hockey championship.
Princeton was a veteran heavy team as well. Zero freshmen were in the top 10 scorers; all 4 in the top 10 were sophomores. Out of the 6 upperclassmen, 5 of them were seniors as well. Since Princeton cannot use the portal as an Ivy League team, they likely will not be continuing their ascent under Ben Syer this coming season, but it has been a successful rebuild thus far for sure. They likely will just be taking a different path than the usual 5 year plan.
While based on the numbers, you would probably think that Maine was balanced and leaning veteran heavy, I would argue they fall into the first category. They had a large, quality freshman class, but a lot of them just didn’t fall into the top 10 scorers. For 11-17 on the scoring list, 6/7 of those players were underclassmen, 5 of them being freshmen. Most of them just played depth roles to start out. Given their recruiting rankings and that roster context, they fall into the first category.
UMass absolutely falls into that category as well. All 5 of their top 5 scorers were freshmen! Even 9 out of the top 10 being underclassmen is absolutely nuts. John Leonard, Mitchell Chaffee, Oliver Chau, Mario Ferraro, and lastly, some guy named Cale Makar formed the nucleus of the team that would lose in the national championship the following year. UMass had by far the best recruiting class on the list and fall into the large and high quality freshman class category.
Miami had the biggest jump of all programs here as they won a whopping 15 more games and jumped 30 spots in the rankings. They were another team in the big, high quality freshman class category. Most of their scoring came from underclassmen including 3/5 top scorers being only freshmen. It truly was an impressive season from them, and I’d bet that they take another jump this season with the core established.
Successful
I’m considering any program going up 10-19 spots as “successful.” This meant they took a good sized jump, but it wasn’t too crazy of a leap.
AIC went fully into the large freshman class strategy. While unfortunately the Neutral Zone rankings for them are no longer up, I can pretty much guarantee that they would have been high in the overall rankings due to a big class. They would not have been very high in the average rankings though since AIC was largely not able to get quality recruits (making Lang’s success there all the more impressive). This strategy resulted in all 5 top scorers and 9/10 coming from freshmen and sophomores, which is crazy, and it set the stage for big years down the road.
St. Thomas was in just year 2 of being D1 after moving up from D3. They went fully into bringing in a ton of freshmen as evidenced by their top 10 recruiting class ranking but only 41st in average. Their scoring was heavily tilted towards that youth with all 5 of their top 5 scorers being freshmen! These players all formed their foundation going forward as St. Thomas continued rising up.
Just Okay
Any program that improved less than 10 spots in the pairwise/NPI is in this category. All but 1 of these rebuilds are not really comparable to RPI this year. Almost all of these programs took a more balanced approach, while only Union and Merrimack were different from that.
Holy Cross was mostly a balanced team. They leaned slightly veteran but had some key underclassmen who became core players for the future teams that rose up under Riga. You’ll find that all the teams that fall into the “balanced” category were just okay in terms of results. Going hard into either a veteran heavy team or a high quality and big freshman class always yielded the best year 2 results.
Augustana was also in the balanced category but leaning slightly towards youth. For them, it made sense to go more balanced because they were in year 2 of a brand new program starting from scratch. They built the program with a combo of incoming freshmen recruits and a lot of transfer portal usage. This makes sense because you wouldn’t want a crazy imbalance of class years starting up. For their improvement though, it meant they only slightly improved from the year prior, but they were still solid overall. It set the stage for a good year 3 this past season.
Dartmouth was the only team to actually get worse from year 1 to year 2. I remember it being a surprise because I thought they were going to have some improvement heading into that year. They didn’t have a big freshman class nor a quality one, but generally, they were still pretty youthful from the freshman class the year prior. They’d fall into a similar category as Augustana as a balanced team that leaned towards youth. Their issue overall was really just that all the players they returned from year 1 didn’t really improve in year 2. It took another year of development for Dartmouth to really start blossoming.
RPI had some moderate improvement from year 1 to year 2 under Dave Smith. I’d say they were balanced but slightly veteran heavy. While 4/5 and 6/10 top scorers were upperclassmen, they did have a lot of freshmen playing immediately too, including star goalie Owen Savory. The top players were mostly upperclassmen, but the top 10 scorers included future core pieces like Ottoville Leppanen, Ture Linden, Jakub Lacka, and Kyle Hallbauer in addition to Savory in net.
Union was very much veteran heavy with zero freshmen in the top 10 scorers, and only 3 underclassmen total. They are really the only veteran heavy program to not improve a lot in this deep dive, which is surprising. A lot of these older players continued developing well in the following year, while Union effectively used the portal to fill in the gaps.
Merrimack had a top 10 recruiting class going into year 2, and it was also high in quality, comparable to Maine and Miami. Out of their top 10 scorers, 6 were freshmen and 8 were underclassmen. The results say they only went up 9 spots in the pairwise, placing them in this group, but this is one of the few cases where I feel that’s misleading. I think they would have been right up there with those teams had it not been for disastrous goaltending. Merrimack ended up with a 0.871 team SV%, which was by far the lowest in the country. They split the net between two freshmen, Troy Kobryn and Jere Huhtamaa, who both really struggled. Kobryn and Huhtamaa were not the answers in net for Merrimack’s rebuild. After combining for 40 games played as freshmen, they combined for only 7 games played the remainder of their careers. Simply put, Merrimack missed in recruiting at goalie with those two, and they moved on quickly. It hurt their second season under Scott Borek even though they figured it out long term.
LIU improved in year 2 behind a veteran heavy team built mostly through the transfer portal. Since they had started from nothing the year prior, they had a huge freshman class that season, so they kept the class small in year 2. While LIU didn’t have a pairwise in their first year to look at for official placement, they ended up at 53 in their second year, and there were only 61 programs in 2020-21. It would’ve been impossible for them to improve 10+ spots, so they are in this group.
Applying this to RPI this Season
You may have guessed where RPI falls in this year. All the teams in the big and high quality freshman class category had top 15 recruiting classes overall and had top half of the country classes by average. RPI is #14 overall and #22 by average in the Neutral Zone rankings. The categories breakdown like this (NZ ranking/NZ average ranking):
Big and high quality freshman class
Maine (13/31)
UMass (3/14)
Merrimack (7/29)
Miami (14/29)
RPI - under Eric Lang (14/22)
Veteran laden team
Bentley (60/44)
Princeton (51/52)
Union (53/51)
LIU (47/51)
Big and low quality freshman class
AIC (N/A)
St. Thomas (8/41)
Balanced
Holy Cross (42/53)
Augustana (30/23)
Dartmouth (46/48)
RPI - under Dave Smith (29/47)
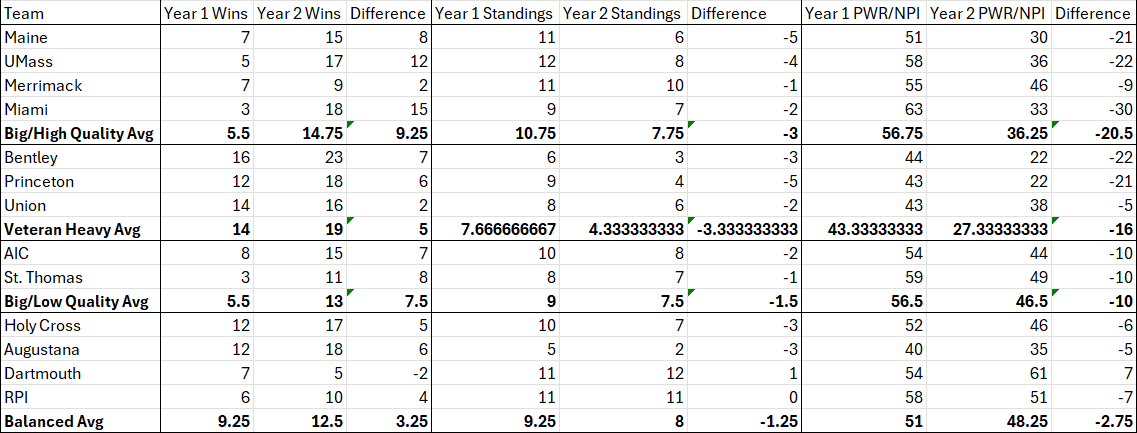
This breakdown shows the results for year 2 pretty clearly based on strategy. Across the board, balanced teams had the least improvement in year 2. Big freshmen classes with low quality generally had solid improvement but nothing too crazy. Veteran heavy teams didn’t necessarily improve as much as big freshmen classes with high quality, but they were more successful because they all started from a better spot with an average of 14 wins and 43rd in the pairwise/NPI year 1.
The best strategy, at least for year 2, is obviously the big and high quality freshmen classes. It should make us feel very good that this is clearly the strategy Coach Lang has chosen to go with given these results from other programs. The fact that RPI’s recruiting class is arguably the second best on this list (if you go by average quality) is even more of a bonus.
Let’s now set the expectations based on these similar programs (and including AIC as a proof of concept for Eric Lang specifically).
First, in wins, the comparable programs averaged 9.25 wins of improvement from year 1 to year 2. Simply put, that’s not happening; RPI is not getting to 20 wins this year. I think it’s fair to say that Lang got the most out of last year’s team in order to get 11 wins, and the other programs all started in the single digits for wins. They had a lot of runway to grow. AIC improved by 7 wins, and that’s probably the high end of improvement for RPI this year. Merrimack only improved by 2, and I’d say that’s probably around the floor given that they were only that low because of horrendous goaltending.
Their actual win totals are more useful here in my opinion. Those come out to be 9, 15, 17, and 18. AIC also had 15. That 15-18 range is right where I expect RPI to land.
The standings aren’t super useful to look at in this case because none of these programs play in the ECAC, but we will still take a quick look. Their placements were 6, 7, 8, and 10 with AIC landing in 8th as well. That 6-8 range is where I expect RPI to land too, and that seems reasonable given the talent on the roster and the state of the ECAC.
Lastly, the NPI is where we look, and here the improvement totals actually are relevant because RPI is coming from a similar range as the others. They averaged a whopping 20.5 spots of improvement and #36.25 in the rankings. That is within the realm of possibility, but I think that would be on the higher end of outcomes. AIC started in the same #54 spot as RPI and improved 10 spots to #44, which is probably the floor. For the others, you have 30, 22, 21, and 9 spots of improvement. You can rule out 30 for RPI this year; I just cannot see that big of a jump happening. I’d say 22 spots of improvement is probably the ceiling based on my gut feeling. The comparable programs’ placements in the pairwise/NPI were #30, #33, #36, and #46. Again, my gut feeling is that RPI isn’t quite as high as some of those teams despite the quality of the recruiting class. I’d expect the 35-40 range.
Overall, RPI is clearly on the right path in the rebuild given the data and the strategy taken. I’m very optimistic for the future of the program with Eric Lang at the helm, and this is shaping up to be an exciting year with lots of young talent getting acclimated to college hockey.
With the quality of the recruiting class, it would be fair if you’re more optimistic than I am based on the data. However, I don’t think the expectations should be that high as that kind of improvement would be a huge jump. I’d prefer for more cautious optimism as the program still has a long way to go and a lot of work to be done before becoming relevant.
My predictions:
16 wins (+5)
7th in ECAC (-2)
39th in NPI (-15)