


When I decided I was going to model player progression for my ECAC prediction model, I had to choose the proper way to do that.

Age curves are nothing new to hockey. From fans arguing that their career bottom 6 forward can breakout at age 26 to Dom Luszczyszyn’s fantastic work applying it to his projection models, it’s a constant debate of trying to correctly predict how players will perform in the future.
College hockey doesn’t have anything like that, not yet at least, with its niche (but awesome, I must add) fan interest and a lack of data available publicly. The general thought has always been that rising sophomores will improve the most with that improvement gradually dropping as the years go on. That’s definitely true generally. When it came to trying to model it though, I thought that I could do better than just going based off of class year by using the player’s actual age. That’s how the NHL age curves work, and it’s more specific. I figured it would be more accurate to say that an 18 year old freshman moving to his sophomore year would improve more than a 21 year old freshman.
I decided to move forward with that theory for modeling player progression and figured I could mess around with various options if it didn’t look good. However, those other options were not necessary at all as the age-based progression turned out to be very clean data.
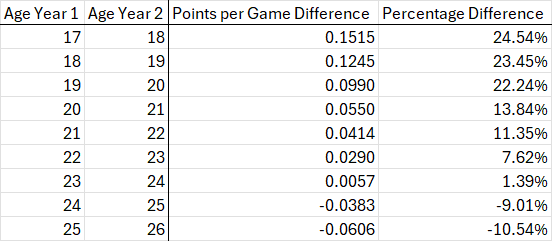
I used the past 4 years of data from 2022-26. I’ll just explain the data a bit before breaking it down. First, age is defined by a player’s birth year and is based on the start of the season. A 17 year old for this upcoming season would be any ‘09, an 18 year old is any ‘08, etc. Second, I only included players who played in NCAA D1 at both ages in the data. Points per game difference is the average change in points per game from year 1 to year 2 at those ages. The percentage difference is just turning that into a ratio by dividing year 2 by year 1. Lastly, the final 2 rows are not really relevant. Assuming no redshirts or extra years, even an overager starting at 21 years old would end their career at 24 years old. The only reason those two rows even have data is from COVID granting everyone an extra year of eligibility. The 24→25 row is basically exclusively players who started college at 21 years old who decided to play a 5th year instead of going pro. The 25→26 row has a sample size of two players who only got 6 years because they had a redshirt year, and then, they had the COVID year on top of that.
For the data itself though, it works out extremely neatly, much more than I thought would. To me, that validates using age for progression rather than the class year. Unsurprisingly, the younger the player is the more they improve in point production from year to year. The improvement is also pretty moderate in general. While there are certainly numerous players who take huge leaps forward, a player is only going to improve by a few points a year on average. Those big leaps forward get averaged out by the players who regress and don’t produce as much.
One thing I wonder if the data would show is if the improvement is different for different tiers of players. In other words, I think elite players would probably show much more improvement than a middle of the lineup player, and a middle of the lineup player would show more improvement than a bottom of the lineup or depth player. For now, I think this is good enough to use as a simple model for my ECAC projections. In the future though, I will probably do something like that to further improve.
That’s all I’ve got for you; I wanted to keep this one pretty short!