

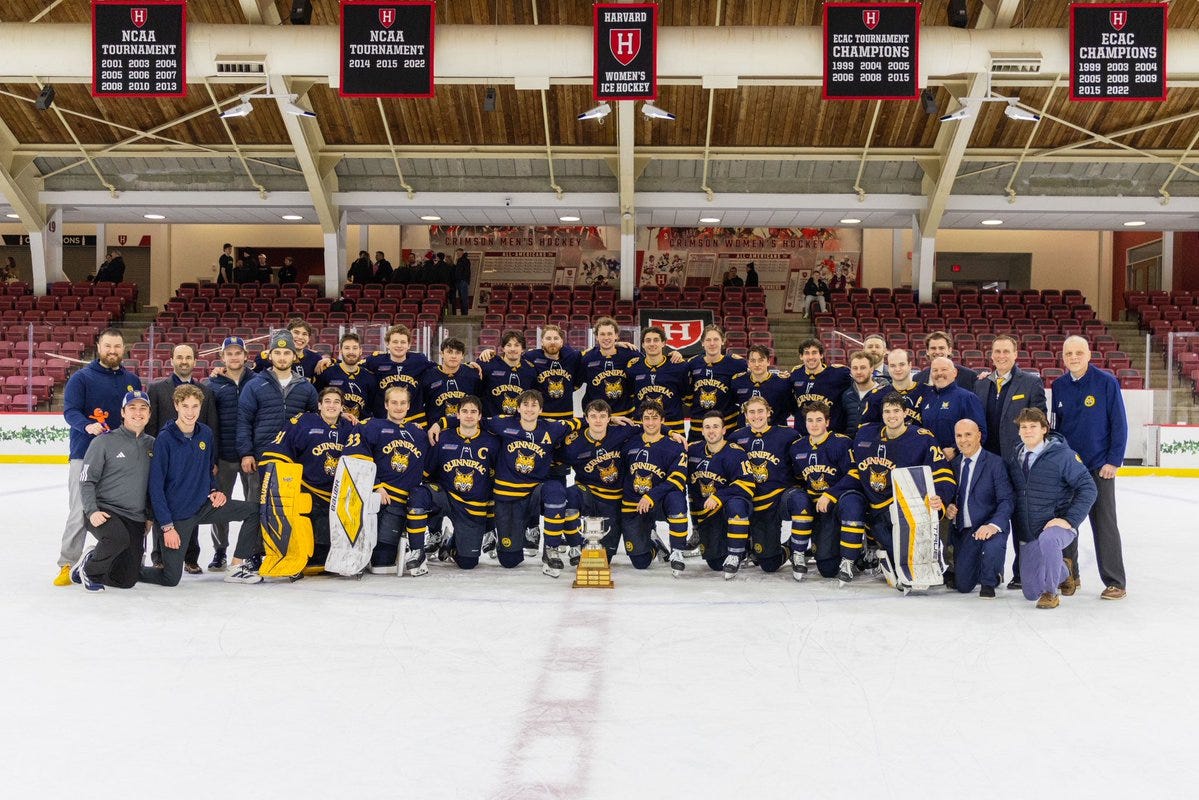
After the COVID year that saw 8 of the 12 teams in the ECAC take a full year off, people in the media thought there was absolutely no way to predict the standings for the 2021-22 season with any level of confidence. I disagreed with this. We knew generally how good the returning players were, even if we couldn’t predict how players would improve. We also know about how good incoming players are based on the junior league they played in and how they performed in that league before enrolling in college. It was this basis that sparked my idea to create a model to predict the standings, and I went ahead and did that.
The results immediately were great. The model was highly accurate and won a USCHO ECAC standings prediction contest that season. Over the years, I’ve made some small tweaks here and there, but I have noticed some consistent blind spots in the model that it has gotten wrong. Before we get there though, I wanted to do a retrospective of this past season and how the model did.

Quinnipiac
Projected Finish: 1st
Actual Finish: 1st
What I Said
Overall, Quinnipiac profiles as a national championship contender this season. They are projected to be the best team in the league by far with an elite offense and a similarly elite defense backed by the best returning goalie in the league. The only weakness is inexperience on the blue line, and that’s nitpicking to find an issue.
What Actually Happened
I was pretty spot on with Quinnipiac minus the goaltending situation. Throughout the year, they were a top 10 team, and they were also one of the best teams in the country in terms of puck possession and scoring chances.
The goaltending was the only weakness as both Matej Marinov and Dylan Silverstein struggled, which was unexpected. Marinov had a 0.913 SV% as a freshman and a 0.928 SV% as a sophomore. In the year before arriving at Quinnipiac, he had a 0.917 SV% in the USHL. Needless to say, it was a big shock that he dropped all the way down to a 0.898 SV% last season. Silverstein had a 0.912 SV% in limited time, but even that is not great behind the strength of Quinnipiac’s defense. This was the big miss by the model, but honestly, I don’t think it was foreseeable by the model given Marinov’s pedigree prior to the year.
Overall though, that didn’t hold the model back from getting it right with Quinnipiac since everything except the goaltending was exactly as predicted.
Clarkson
Projected Finish: 2nd
Actual Finish: 8th
What I Said
Overall, Clarkson has a lot of talent and depth, which should put them near the top of the league and in the mix for the NCAA tournament. However, they still have plenty of question marks. The forward group is extremely young and is full of CHL players. How will they adjust to the NCAA? If it’s not well, they could be in trouble. While it’s not as youthful, a similar question exists on the defensive side.
Lastly, and probably most importantly, the situation in net has major question marks. Can Soderwall transition well from D3? If not, can Rancier regain his Minnesota State form or was he just bolstered by their strong defensive system and his UVM play is more representative of who he is? Is Avakyan as good as his NAHL play suggests or did he just play well in a weak league and his WHL form is his true level?
I think Clarkson is probably a year or two away from being a no doubt NCAA tournament team again. This year though, I do agree with the model that they’ll overcome the youth question marks due to their talent, and that Soderwall will transition well enough in net to make them a strong team that either just barely makes the NCAA tournament or is just outside the field. They’ll be an interesting team to watch for sure.
What Actually Happened
Clarkson’s youth did indeed up being a big problem. They proved to be a talented but mercurial team. The highs were extremely high: wins over Penn State and North Dakota. The lows were arguably just as low though with losses to RIT and Canisius. At the end of the season, they did come together to play their best hockey and upset Quinnipiac in the ECAC Quarterfinals to earn a Lake Placid berth. However, there’s no doubt here that this was a miss by the model.
A couple things went wrong: the youth on the team and some injuries. First, the youth didn’t adjust as smoothly as projected, and I was rightly skeptical of the model assuming they wouldn’t miss a beat considering the number of freshmen slotted into key roles right away. Clarkson was actually solid offensively at 2.92 goals per game, and considering that Adrian Misaljevic and Mikael Huchette both missed practically the entire season (Misaljevic got 6 games and Huchette didn’t play any), they didn’t end up too bad there.
The real issue causing the model difference was the defense being well below expectations. The model projected the defense at 2.20 goals against per game, but they ended up at 2.92 goals against per game. Even though they were losing Trey Taylor and Kaelan Taylor, the model liked the returners enough to not project too much of a fall off, and the freshmen were expected to not be too high in the lineup. It also thought the goaltending with Shane Soderwall coming in would be comparable to the goaltending with Ethan Langenegger. Neither happened though. The defense went from 24.6 shots against per game to 26.7 shots against per game. In net, they dropped from a 0.909 team SV% to a 0.891 team SV%. While the freshmen defensemen weren’t in the top 3 in ice time, they were 4-6, and clearly that had an impact. Obviously, the goaltending wasn’t nearly as good either.
The frustrating thing with Clarkson is I kind of saw it coming. The biggest gap in the model has always been that I didn’t build in player progression. This meant that the model has long overrated teams with really large and high quality freshman classes while underrating teams with a lot of returning scoring. Clarkson fell very clearly into the former, but I’ve always just regarded it as an acceptable gap. I don’t think that any longer.
Cornell
Projected Finish: 3rd
Actual Finish: 3rd
What I Said
Overall, I have to agree with the model. Cornell doesn’t look to have the scoring talent that they have typically had in recent years, but it should be good enough. The real strength of the team should be the defense, which will keep them a top team in the league. I expect them to easily make it into the top 4 on the back of the defense. Nationally, I see them as a team that will probably be on the wrong side of the NCAA tournament bubble, but if they can outperform the offensive projection with guys like Castagna taking a step forward, they have a chance to slide into the NCAAs.
What Actually Happened
I was pretty spot on with Cornell overall. The defense was outstanding at 2.03 goals against per game, which was 3rd in the country. I was skeptical about Cornell offensively, as you can see, because I thought they had too many players who projected as middle of the lineup forwards rather than top of the lineup. As I said though, guys like Jonathan Castagna taking steps forward could make them an NCAA tournament team.
That’s exactly what happened. Castagna led the team with 34 points, Charlie Major developed well and took a step forward with 27 points, and Caton Ryan surprised with a 30 point freshman season to fill the gaps at the top of the lineup. With the needed offense at the top of the lineup, they were able to make the NCAA tournament, and they finished exactly where the model had them in the ECAC.
Harvard
Projected Finish: 4th
Actual Finish: 6th
What I Said
Overall, Harvard’s defense projects to keep them from truly regaining status as a top 20 team in the country. Their losses on the blue line keeps their projected improvement from the model pretty mild there, and while Charette was a solid goaltender as a freshman, he doesn’t project to be a great one yet. The offensive talent and model projection on that side means that their improvement should definitely bring them back into the top 6 of the league, and I agree with the model that it will carry them back into the top 4.
What Actually Happened
Harvard did jump into the top 6, but only at 6th place. They did not jump back into the top 4. The reason why was actually very straightforward, which I’ll get to. First though, the model got the defense right. It was about average, and Charette was solid but not great.
The main issue was not only a lack of player development, but all the top of the lineup players for Harvard actually performed significantly worse than the year before. A big factor driving Harvard’s offensive projection was their returning players. Mick Thompson had 32 points, Casey Severo had 28 points, Joe Miller had 23 points, and Ben MacDonald had 16 points. Every single one of those players dropped, and most of them dropped significantly. Thompson had 27 points, Severo dropped all the way to 18 points, Miller only had 12 points, and MacDonald only had 10 points. None of the incoming freshmen or other returning scorers stepped up enough to fill that gap even though there were a few with nice seasons. Unlike Clarkson, I don’t think this miss was really foreseeable. The defense was spot on, and the offense missed because all of the top players significantly regressed. That’s not really predictable for anyone.
Union
Projected Finish: 5th
Actual Finish: 5th
What I Said
Overall, Union’s combination of good offense and defense, without being elite in either, has them projected to be 5th. As I said at the beginning though, this looks like a good team, and they should be in contention for a top 4 spot. The model has them extremely close to Harvard, and I could see it going either way.
What Actually Happened
I’d say this was mostly accurate on Union’s part, although the team they were neck and neck with for 4th was Princeton and not Harvard. Union is a little bit tough to judge by the numbers because their strength of schedule was SO weak that it heavily inflated their numbers overall. They had 3.78 goals per game offensively and allowed 2.65 goals per game defensively to lead to 22 wins, yet they didn’t even sniff the NCAA tournament because of how weak the schedule was. They finished 26th in the NPI.
For ECAC-only numbers, they scored 3.23 goals per game and allowed 3.09 goals per game. Both those are pretty in line with what was expected. The offense was a bit better while the defense was a bit worse than the model predictions. Overall, Union was pretty clearly a hit by the model.
Dartmouth
Projected Finish: 6th
Actual Finish: 2nd
What I Said
First, the defensive production lost on the blue line is a lot. Only RPI, who got ravaged in the transfer portal after their coaching change, lost more defensive production. Dartmouth lost both John Fusco and Ian Pierce as mentioned in the offense section. This may not seem like a lot, but it’s the quality of their play that matters here.
John Fusco was excellent defensively in addition to his offense and represents a huge individual loss. Ian Pierce didn’t play the full season due to injury, but his defensive impacts were also quite good. The model may be overrating the defensive impacts of only two players, but they are big losses without a doubt.
The other main flaw for Dartmouth that none of the other top 6 teams have is in the goaltending department. I was high on Emmett Croteau last year despite his struggles at Clarkson, but last year, he was below average for Dartmouth. He has enough of a track record now that the model is going entirely off of his college play instead of including the very good USHL pedigree. And that college track record has not been good. If he can breakout, Dartmouth can for sure make me look silly, but he has yet to show a high enough level of play at the college level.
All of this results in a projected 0.31 drop in goals against average, which puts them in the bottom half of projected defenses in the conference. They will need improved goaltending and some defensemen to step up defensively to mitigate the losses there in order to outplay that projection.
Overall though, they are still very much in range to get into the top 4. They are not very far behind Union and Harvard in the projections, and I wouldn’t be surprised if they can be better defensively than expected. They’ll be a pretty competitive team once again.
What Actually Happened
I wouldn’t say the model was totally off base on Dartmouth despite ending up as the #2 team in the league. I was right when I said that Croteau could improve and make the model projection look silly. That combined with a couple of other factors were where Dartmouth was able to outperform the model.
First, Dartmouth’s player development was outstanding and far beyond the typical growth. Both Hayden Stavroff and Hank Cleaves doubled their scoring output to put up monster years. Those are obviously the main two and the most important ones, but there were others too.
Tying into player development a little bit, the defense did not actually decline at all. Despite losing Fusco and Pierce, Dartmouth did not miss a beat there. They went from 23.6 to 24.0 shots against per game, so they were still at around the same level of great defense. Eric Charpentier took another step defensively and was a dominant shutdown force for the Big Green. Colin Grable came out of nowhere to score 20 points in 35 games and had a +30 rating showing outstanding ability in both ends. The year prior, he only appeared in 19 games with 1 point and an average of 6:42 of ice time per game. That’s just an insane leap.
As I mentioned before, Croteau also took a big leap going from a 0.903 SV% to a 0.922 SV%, which was the biggest factor defensively.
I don’t think there was any single “miss” here by the model. There’s no way to predict that level of player development, and sometimes, you just have to tip your cap to the players and coaching staff for succeeding to that extent. The goaltending was a little bit more predictable, but it’s tough to blame the model for being skeptical when Croteau had not performed to the level of a good D1 starter prior to the season. All of these factors just combined to make Dartmouth not only a top ECAC team, but a top 10 team in the country.
Colgate
Projected Finish: 7th
Actual Finish: 7th
What I Said
Overall, Colgate needs to find some top end players to keep their performance from last year. They have managed to do this before and prove the model wrong, so it’s certainly not a foregone conclusion. I’m definitely skeptical though. The bigger issue in my eyes is that the defense projects to be below average and without a true #1 goaltender. That limits their ceiling a lot in a league where a lot of the middle teams are improving.
What Actually Happened
I’d say this was pretty on the money in terms of what happened. There were a few players who were close to being top end players but weren’t quite there. If Nagel had stayed healthy during the season, he probably would’ve qualified, but he missed a decent chunk of time. The biggest surprise in terms of top end players was the way Michael Neumeier struggled in his #1 minutes with a -28 rating despite having 23 points. Even with playing 27 minutes a night against tough matchups, a #1 should not be struggling to that extent. Lastly, the goaltending was indeed a struggle with both Andrew Takacs and Reid Dyck hovering around a 0.900 SV%. They landed right where they were predicted.
Brown
Projected Finish: 8th
Actual Finish: 12th
What I Said
Overall, Brown’s defense should keep them competitive this year even with the offseason losses. The offense has enough top end talent to score more than most of the bottom of the league teams even though the depth is pretty dire and will really hurt them. I think people are being a little too harsh on Brown after the offseason, and the model doesn’t have them that much behind Colgate. It’s possible they could surprise people even though their ceiling is probably limited.
What Actually Happened
Brown ran into similar issues as Harvard did with their top players regressing and not playing at anywhere near the level that was needed of them. Ryan St. Louis went from 29 points to 15 points, and Brian Nicholas went from 25 points to 13 points. Their talent was already lacking significantly with zero depth to speak of, and it was expected that those two would carry the load offensively. With those two falling that much, it meant their offense had practically zero firepower despite Ivan Zadvernyuk taking a jump up to 22 points. That was a major issue.
The other main issue was the huge drop in the team defensive play. The model projected Brown’s defense to be slightly above average like it had been the year before, but it totally fell off. They went from allowing 30.5 shots per game to allowing a whopping 36.8 shots per game. That’s a massive difference over one year, and it’s particularly confusing because Brett Bliss was the only real loss on the blue line.
Those were both massive gaps from the model predictions, and it led to Brown dropping all the way to 12th in the league. Similar to Harvard, I don’t believe it was predictable, and sometimes teams are just going to surprise in one direction or the other.
Princeton
Projected Finish: 9th
Actual Finish: 4th
What I Said
Overall, Princeton is a really vanilla team. They lack offensive talent and will struggle to score. The defense should be solid though and keep them competitive in most games. It is what keeps them in 9th above the other bottom teams in the conference. They have the potential to surprise if enough of the younger players step up, but they look to be a pretty plain team that will play a lot of low scoring games.
What Actually Happened
This was a miss by the model that should have been more predictable to me than it was. Princeton had the 4th most returning scoring in the conference, and they were not losing any key forwards up front. On the blue line, they were losing their #2 defenseman, but returning everyone else. Even though they were returning a lot, I looked at the players coming back who were solid but unspectacular and just didn’t see enough talent.
I should have realized though that the players would continue to take steps up. Usually, I feel that I’m pretty good at recognizing that and factoring it in mentally even though the model doesn’t, but I missed on that with Princeton. The model missing on that since it doesn’t factor in player progression makes a ton of sense. This is one that feels obvious in hindsight and again exposes a major blind spot of the model.
Now, even if the model did factor in player progression, Princeton still would not have been predicted to finish 4th. Like Dartmouth, their players and staff deserve credit for the big leaps a lot of players took. However, I’m positive that they would have been at least a little higher and not as big of a miss, and that’s still important.
St. Lawrence
Projected Finish: 10th
Actual Finish: 11th
What I Said
Overall, it’s really tough to see St. Lawrence rising out of the bottom 4 this year. Even with some pretty significant defensive improvement projected, it’s only enough to raise them to 10th. Offensively, they just don’t have the talent to really compete in the league and look like the worst scoring team in the ECAC.
What Actually Happened
The model was pretty much correct on St. Lawrence. The offense ended up being slightly better than expected due to the emergence of a lot of young players in the lineup, but it was only a slight difference. That improvement was counteracted entirely though by the defense not actually improving. It was the worst defense in the country in part because their 0.877 team SV% was also the worst in the country. Overall, there’s not too much to write about here because the model was right that they lacked talent, and the defense was even worse than projected (which was pretty bad!).
RPI
Projected Finish: 11th
Actual Finish: 9th
What I Said
There’s always some unknowns with a new head coach, but the first year in a new head coach’s rebuild is pretty much always a tough year. Even some of the recent successful rebuilds, such as Maine with Ben Barr, started out with single digit win seasons. Maybe Lang can buck that trend with so much turnover defensively and a new defensive system in place, but I think it’s unlikely to expect a team with so many new faces to vastly improve immediately on defense. Overall, RPI’s depth should have them competing in most games, but the roster needs a lot of work in future years as Lang takes the reigns.
What Actually Happened
This was also pretty spot on. RPI lacked scoring ability with the top scorer putting up 22 points, and then it fell to 18 for the next highest scorers. The depth was solid and usually allowed them to stay competitive within games. The defense still struggled with an entirely new system and a ton of young players seeing a lot of ice time, but it ended up being a bit better than expected. At the end of the season, the team really started coming together to execute the defensive system, and Krawchuk found consistency as the #1 in net. That allowed RPI to surpass the projection by a little, but ultimately, the model was right about the lack of talent in the first year of a rebuild with Eric Lang.
Yale
Projected Finish: 12th
Actual Finish: 10th
What I Said
Overall, Yale has a nice, young core to build around, but they still lack scoring talent and will struggle in that department. They need to do a better job recruiting to surround that core with better pieces. Even with big jumps from the young players, it will not be enough to be more than a below average offense. Defensively, Yale will need Stark to return to his freshman year form to have success, and their ceiling as whole pretty much lies with him.
What Actually Happened
This was another team the model was spot on about. The offense was below average despite having some nice young players on the roster. Defensively, Stark did not recover and once again struggled a lot. They ended up turning to Noah Pak to start more as a result, and while he was better, it still was not good. The defense was in the bottom 10 of the country. Honestly, the reason that Yale was 10th and higher than the model prediction had nothing to do with Yale being better than expected. It was pretty much solely because Brown and St. Lawrence were worse than expected.
Classifying the Teams
Breaking down the teams into categories, here’s how I see it.
Hits
Quinnipiac
Cornell
Union
Colgate
St. Lawrence
RPI
Yale
Unpredictable Misses
Harvard
Dartmouth (went back and forth on this one but the areas they outperformed weren’t really predictable by a model)
Brown
Predictable Misses
Clarkson
Princeton
Overall, it’s pretty good, but the predictable misses do have me kicking myself.
Tweaks Coming
In the past, I’ve avoided trying to model player progression because I wanted to make a robust model taking into account numerous data points. I tend to be a bit of a perfectionist. What I have realized though is that even a simple player progression model would be effective and better than not doing anything. As they say, “perfect is the enemy of good.”
Additionally, while my initial freshman projection model was fairly accurate, I have noticed it drift further from reality the past few years. Considering the model was trained on data from about 2016 to 2020, it makes sense that it would drift. This resulted in freshmen consistently being overrated in terms of how they will perform immediately.
Initially, I was okay with it when I realized it because I figured this would counteract the lack of player progression included in the model. However, very large freshman classes for a team with not much returning scoring or very small freshman classes for a team with a lot of returning scoring would clearly not even out. This is exactly how it played out with Clarkson and Princeton.
I refuse to let these obvious (and fixable) blind spots exist any longer though. Stay tuned for an upcoming post about player progression with my research findings there. I will also re-calibrate the freshmen projections to make those accurate in present day. This should elevate the model’s performance from good to great. These updates will be included in the model for the upcoming season, and I’ll describe them more in-depth when I do my yearly ECAC preview.